Why Isomorphism?

Next Home

I study isomorphism in algebra, which asks how do we tell two algebras apart. Over more than a century, researchers have puzzled over this unsolved question with various motives. It is an exciting time in the subject with advances that have improved exponentially over what we could do even 5 years ago.

What follows is one present day application with a substantial pay off. I hope it will be a gentel introduction, appropriate for students and anyone curious, into some of the work I do.

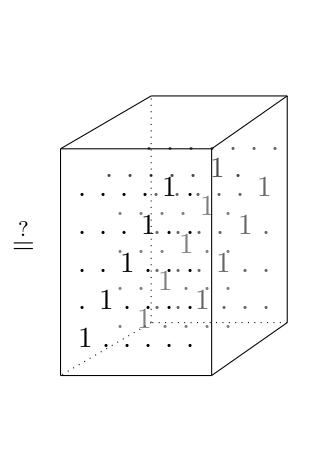
The Goal: Make data coordinate free.

Your data
= What is really changing.
Our isomorphism tests

Measurement makes observations into numbers. To do that, we seem to need coordiantes and scales. E.g. fix xyz directions, choosing meters or feet, assigning each color a number, etc.. In real data, repeated measurements cannot guarantee the same coordinates. This creates a problem.

Data is senstive to coordinates.

How can we tell if data has changed, or if we just recorded the same event but in different coordinates?

A closer look at coordinate problems.

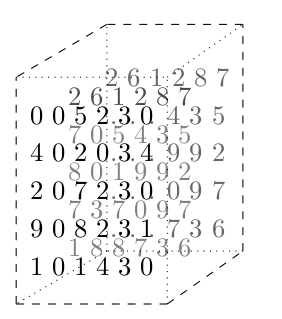
I think of data as uniform tables of numbers (you may need to fill in missing numbers with 0). 
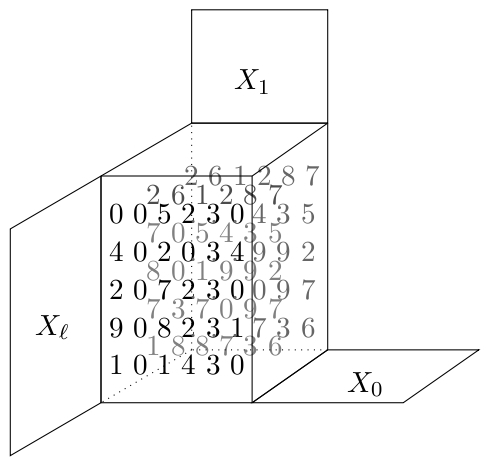
E.g. a digital picture measures the color of point $(x,y)$ in an image, recording it as pixel $T_{xy}$. We might also add coordinates $RGB$ to interpet color as "Red", "Blue", "Green", which we do by adding a 3rd dimension to our frame of reference, e.g. $T_{xy}^{RGB}$.

Predictable coordinate changes include changing lengths of $x$ and $y$, e.g. centimeters to inches. Or swapping Red-Blue-Green (RGB) with Cyan-Yellow-Grayscale (CYK). Here official standards take care of of organizing the converstion of coordinates. So data recorded in on coordinate system is easy to compare with data recorded in another, so long as we are told about the system of coordinates.

Difficult coordinate changes result when we cannot even know what coordinates are involved. Consider the following.

  • Every day you take a picture of a leaf to look for changes, but you cannot reposition the camera identically each time. Your xy-coordinates change over time. Changes in color scales can occur if you buy a new camera and many other subtle changes.
  • You need a table of the network traffic between computers. Each computer gets an address but that address is randomly assigned and changes over time. Over time different collections of the same data may shuffle the orders in the table with no practical method to keep track.
  • Metadata is the result of processing other data, e.g. by taking gradiants, symmetires, or other functions on our given information. That processing necessitates often arbitrary and even randomized choices within the algorithms that produce the metadata. Controlling for the resulting coordinates is either too complex or at times a theoretical impossibility.

My approach to coordinate-free data.

I convert data into algebra where the effects of coordinates have predictable effects, known as isomorphism.

What makes algebra a natural tool for data.

Algebra is the study of equation solving. You have two problems:

  • invent numbers to call the solutions, and
  • make algorithms that find solutions.

For example, to solve $x+2=1$ you invent negative numbers along with algorithms for subtraction. For $3x=2$ you invent fractions along with the division algorithm. Perhaps most instructive is $x^2+1=0$ where the integers have no solution, complex numbers have $2$ solutions, meanwhile the quarternions you encounter in calculus have at least $6$ obvious solutions: $\pm i$, $\pm j$, and $\pm k$. In fact, the quarternions have infinitely many solutions to the quadratic equation $x^2+1=0$.

So Different number systems give different solutions to the same equations.

However, if we change our coordinates or write our algebras with completely different symbols, for example as follows, the solutions to our equations remain the same!

$1$ $i$ $j$ $k$
$(1,0,0,0)$ $(0,1,0,0)$ $(0,0,1,0)$ $(0,0,0,1)$
$\begin{bmatrix} 1 & 0 \\ 0 & 1\end{bmatrix}$ $\begin{bmatrix} \sqrt{-1} & 0 \\ 0 & \sqrt{-1}\end{bmatrix}$ $\begin{bmatrix} 0 & 1 \\ -1 & 0 \end{bmatrix}$ $\begin{bmatrix} 0 & \sqrt{-1} \\ -\sqrt{-1} & 0\end{bmatrix}$

The moral:

  • Data that is different gives different algebras.
  • The same data in different coordinates gives equal algebras.
  • Most algebra has algorithms behind it to make these features accessible.


Next

Copyright © 2017 James B. Wilson

Previous

Tensors

Next

Data and Tensors

For my purposes, all data is assumed to come as a uniform grid of numbers, such as $[2,3,0,5]$, $\begin{bmatrix} 1 & -1 & 0\\ -1 & 1 & 2\end{bmatrix}$, or

Uniform here means all rows have the same length, columns have the same length (possibly different from the lengths of rows), and so on. When this is not the case it is often possible to insert $0$ values to fill out all rows, cols, etc. to the same length.

Tensors, first definition.

A tensor is a uniform grid of numbers. Each edge of the grid is assigned a coordinate chart. The frame is the collection of all coordinate charts.

Examples.

Previous

Equivalence

Next

Measurement and Tensor Equivalence

Measurements are functions $\mathcal{M}(\mathcal{O},\mathcal{F})$ that take as input an observation $\mathcal{O}$, and a frame for reference $\mathcal{F}$, and output a tensor framed by $\mathcal{F}$.

Tensor equivalence:

Given measurements $\mathcal{M}(\mathcal{O}_1,\mathcal{F}_1)$ and $\mathcal{M}(\mathcal{O}_2,\mathcal{F}_2)$, decide if the observations agree, i.e. $\mathcal{O}_1=\mathcal{O}_2$.

Changing coordinates breaks down into scaling, re-ordering, or adding together entries in the data. These steps are collectively known as tensor contractions but you may know them by the name of matrix multiplication or row and column operations which is the name we use when our data is 2-dimensional grids.

More on tensor contraction.

The simplest contraction is between tensors with a single coordinate chart, e.g. $u=[2,5,0,7]$ and $v=[1,0.5,9,-7]$. A contraction here is a function that replaces a pair $(u,v)$ of coordinates with a single number, i.e. it contracts the two tensors. There are some requirements to maintain the geometry. For instance if we scale $u$ or $v$ the result should scale, and if we translate the the result should distribution. So int total we need the following. $$(u+u',v)=(u,v)+(u',v)$$ $$(u,v+v')=(u,v)+(u',v')$$ $$(\lambda u,v)=\lambda(u,v)=(u,\lambda v)$$ Such functions are called bilinear forms.

For contractions of general tensors $T_1$ and $T_2$ having many coordinate charts, we first a chart $U$ in the frame $\mathcal{F}_1$ for $T_1$ and $V$ in the frame $\mathcal{F}_2$ of $T_2$, and then contract $(U,V)$ producing a new tensor $T_1*T_2$ framed by $$(\mathcal{F}_1-\{U\})\cup(\mathcal{F}_2-\{V\}).$$ For example a $(2\times 3)$-matrices times a $(3\times 4)$ matrix is the contraction along $3$ and returns a tensor (a matrix) on the remaining terms in the frame, namely a $(2\times 4)$-matrix.

Tensor Equivalence By the Numbers

Given two tensors (illustrated below as the two volumes of numbers), guess a change in coordinates $X_0,X_1,\dots,X_{\ell}$ (below $\ell=2$) to change the frame of the first to the second and see if the resulting data agree.

Previous

Copyright © 2017 James B. Wilson

Next
Previous

Algebras from Data

Home

Algebra from Tensors

Getting algebras out of tensors is on the surface quite easy. We can just insert the data to describe a multiplication. See below for one way to do this.


How to make a multiplication out of a tensor.

Suppose we have a tensor $T$ framed by $(\mathbb{R}^a, \mathbb{R}^b,\mathbb{R}^c)$, that is a grid of numbers arranged in a $3$-dimensional array that is $(a\times b\times c)$. Then just just by using contraction we get a multiplication $\mathbb{R}^a\times \mathbb{R}^b\to \mathbb{R}^c$ as follows. $$ (u_1,\dots,u_a)\bullet (v_1,\dots,v_b) = \left(\sum_{i=1}^a\sum_{j=1}^b T_{ij1} u_i v_j, \cdots, \sum_{i=1}^a\sum_{j=1}^b T_{ij1} u_i v_j\right). $$ We can do the same with any numbers we want, including binary numbers $\{0,1\}$.

This product is highly unusual. First, unless $a=b=c$, we cannot even work out what a cube would mean, for example the following expression would not make sense. $$(u\bullet v)\bullet w.$$ Even if such an express did make sense (e.g. if $a=b=c$) we still could not count on assumption we usually depend on such as associativity, commutativity, and other properities.


The problem is that whatever algebras we might cook up from data directly it will be a rare situation that that algebra is something we understand. We need a leap into algebras we do understand. For that we define a surprising correspondence summarized as follows.

Through careful study we have found precisely which polynomials pair with tensors to make good algebras of operators. For example,

Previous

Copyright © 2017 James B. Wilson

Home