--- an Updated Version will be added shortly ---
ELECTRICAL IMPEDANCE TOMOGRAPHY ( E I T ) |
|
W h a t i s E I T ?
EIT is an imaging technique in which low levels of current are applied through electrodes on the surface of the body, the resulting voltage is measured on the electrodes, and an inverse problem is solved computationally to determine the conductivity distribution in the interior. The results are then used to form an image of the interior of the body. Researchers at RPI have developed the ACT3 system to image ventilation and perfusion in human subjects.
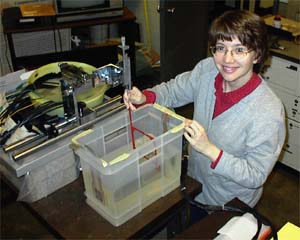
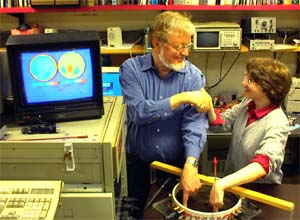
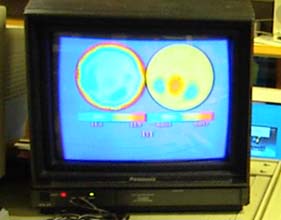
The ACT3 system images subjects in real time. A small demonstration is illustrated below. In the photo, Prof. Jon Newell and I each have a finger in a tank of saline connected to ACT3. On the monitor are reconstructed images. Red depicts high conductivity and blue depicts low conductivity. The left-hand image on the monitor is a static image, which unfortunately didn't photograph well. The right-hand image is a difference image taken from a reference frame before we placed our fingers in the tank. Since our fingers are more resistive than the saline in the tank, they show up as blue regions on the monitor.
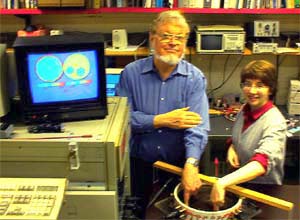
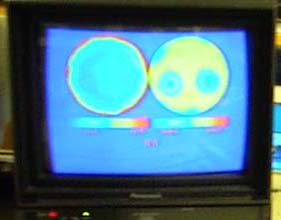
When we shake hands, the current being applied through the electrodes now
flows between us. Since the image is two dimensional, the system assumes that
there must be a conductor in the tank between our fingers. This shows up as a red region between the
images of our fingers on the monitor.
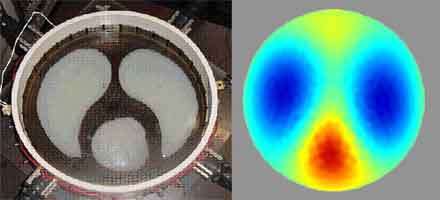
Below is a typical EIT image of a cross-section of a patient's chest during
systole. A reference image was taken during diastole, when the heart is filled
with blood. When the heart contracts, blood empties from the heart and is pumped
into to the lungs and out to the rest of the body. Since blood is very
conductive, the lungs now appear as red regions, and the heart appears as a blue
region, since it is now less conductive than during diastole. This process can
be observed in real time.
To learn more about EIT, please visit the EIT website at RPI, read the recent
survey article in SIAM Review (March 1999) by M. Cheney, D. Isaacson, and J. Newell, or follow
the links to another EIT research group.
C U R R E N T R E S E A R C H
|
A Direct Reconstruction Algorithm for a 2-D Geometry
This project involves the numerical realization of the reconstruction algorithm
outlined in A. Nachman's 1996 proof of uniqueness for the inverse conductivity problem in
2-D. This algorithm is a direct method for solving the full nonlinear inverse problem, and uses the
D-bar method of inverse scattering.
The first results of this work are found in [5] and [6].
More recently, we have further developed the algorithm for use with experimental data,
[2]. Other work on this algorithm can be found in [1],
[3], and[4]. Collaborators on this project include
Samuli Siltanen (GE Healthcare, Finland), David Isaacson (RPI), Jonathan Newell (RPI),
Kim Knudsen (Aarlborg University, Denmark), Matti Lassas(Helsinki University of Technology, Finland),
and Jutta Bikowski (CSU).
Planar Arrays
I am also interested in algorithms for planar arrays of electrodes.
Planar electrode arrays are useful in detecting breast tumors as well as monitoring
ventilation and perfusion. To form real-time images, fast algorithms are needed to solve the
inverse conductivity problem. A 3-D linearization-based algorithm has been developed and
tested on experimental data. Agar targets designed to simulate breast tumors were
suspended in a saline-filled tank with conductivity simulating that of a human breast.
A picture of the tank is found below. The algorithm was also used to detect conductivity
changes due to ventilation and perfusion in a human subject. More recently, Jutta Bikowski (M.S.
2004, CSU) extended this work using the Fast Multipole Method and the shunt model to model the
electrodes.
* may require ISDN or faster connection. |